






Education
Consistency Rule Prop Firm: How It Works
Calculate best-day profit as a share of net profit. Compare strict and inclusive limits and rules at evaluation and funded stages.
Jul 22, 2026 3 min read

Independently ranking 16 futures prop firms
Every ranking is built from a single verified data record. Transparent scores across 16 evaluated firms with no guesswork, no paid placements.

As Seen On







The table below compares six selected current futures programs, each at the nominal $50,000 size, with all figures in USD and data checked October 3, 2026. Note that a nominal $50,000 size refers to the program size and evaluation balance, not a universal simulated-funded starting balance; some funded accounts start at zero. Drawdown mechanics differ meaningfully. An EOD trailing floor updates from the highest closing balance, while an intraday-equity trailing floor can rise with unrealized gains. Threshold update timing and breach monitoring are different concepts, so an EOD account can still breach intraday. Published verified charge figures are known fees; the calculator sums only user-selected charges and excludes other costs, so it is not an all-in price. The selected Apex evaluation price is unverified. All findings come from first-party written terms rather than hands-on trading tests, and prices and rules may change.
To interpret drawdown and consistency mechanics, read our explainers on trailing drawdown and consistency rules. For side-by-side detail, see Topstep vs Apex, Topstep vs MyFundedFutures, and Apex vs MyFundedFutures.
Nominal program sizes and separate account stages. Regular prices in USD. Checked 2026-10-03.
| Program | Fees | Target | Drawdown | Consistency and access |
|---|---|---|---|---|
| TopstepTrading Combine Standard pricing / XFA Standard / no DLL add-on | Regular evaluation price $49.00 [1]Evaluation subscription price before taxes. Standard pricing path. Billing Monthly [1]Combine subscription cancels after passing. Activation $149.00 [1]One-time fee for each earned XFA on Standard pricing. Paid reset fee $49.00 [1]50K Standard Combine reset; separate from XFA reactivation. | Profit target $3,000.00 [3] Minimum trading days 2 [2] | Limit $2,000.00 [4] Calculation End-of-day trailing [4] Breach monitoring Real-time net equity [4]Realized and unrealized losses can breach the current floor intraday. Breach boundary Floor cap $50,000.00 [4] | Rule or target 55% [3] Boundary At or below the threshold [3] Basis Best-day profit divided by total profit [3]Above 55% raises the required profit target. Additional profit must come on a separate trading day. Access days Not verified [1]Monthly subscription; a fixed evaluation expiry was not verified. |
| Apex Trader FundingEOD Evaluation No Activation Fee / PA / Rithmic | Regular evaluation price Not verified [18]Exact selector/checkout price not captured. Do not use Legacy subscription prices. Billing One-time, 30-day evaluation access [16] Activation $0.00 [17]No Activation Fee purchase variant only. Paid reset fee Not applicable [16]New products have no reset; failed evaluation requires a new purchase. | Profit target $3,000.00 [8] Minimum trading days No minimum [8]No minimum requirement; may pass in one trading day. | Limit $2,000.00 [8] Calculation End-of-day trailing [8] Breach monitoring Real-time net equity [9] Breach boundary Floor cap $53,000.00 [9]Rithmic/Wealthcharts evaluation floor caps at target-profit balance. Tradovate keeps trailing. | Rule or target Not applicable [8]No evaluation consistency requirement. Boundary Not applicable [8]Not applied. Basis Not applicable [8]Not applied. Access days 30 [16] |
| Apex Trader FundingIntraday Evaluation No Activation Fee / PA / Rithmic $50,000.00 [12] Source noteNominal program size. Starting simulated balances are recorded separately. | Regular evaluation price Not verified [18]Exact selector/checkout price not captured. Do not use Legacy subscription prices. Billing One-time, 30-day evaluation access [16] Activation $0.00 [17]No Activation Fee purchase variant only. Paid reset fee Not applicable [16]New products have no reset; failed evaluation requires a new purchase. | Profit target $3,000.00 [12] Minimum trading days No minimum [12]No minimum requirement; may pass in one trading day. | Limit $2,000.00 [12] Calculation Intraday trailing [12] Breach monitoring Real-time net equity [13] Breach boundary Floor cap $53,000.00 [13]Rithmic/Wealthcharts evaluation floor caps at target-profit balance. Tradovate keeps trailing. | Rule or target Not applicable [12]No evaluation consistency requirement. Boundary Not applicable [12]Not applied. Basis Not applicable [12]Not applied. Access days 30 [16] |
| MyFundedFuturesBuilder Default / 2000 MLL / current one-time purchase $50,000.00 [21] Source noteNominal program size. Starting simulated balances are recorded separately. | Regular evaluation price $153.00 [21] Billing One-time [23] Activation $0.00 [21] Paid reset fee Not verified Exact current Builder reset price not verified. | Profit target $3,000.00 [21] Minimum trading days 1 [21] | Limit $2,000.00 [21] Calculation End-of-day trailing [21] Breach monitoring Not verified [21]Guide describes open-equity breach determination at day end. Continuous intraday enforcement is not explicitly verified. Breach boundary Not verified Exact touch versus below operator not verified for this stage. Floor cap Not verified [21]The guide gives a general +100 locking statement, without a separate evaluation lock table. | Rule or target Not applicable [31]Builder has no evaluation consistency rule. Boundary Not applicable [31]Not applied. Basis Not applicable [31]Not applied. Access days Not verified [23]One-time purchase; seven-day inactivity is not a fixed expiry. |
| MyFundedFuturesRapid Intraday / current one-time purchase $50,000.00 [30] Source noteNominal program size. Starting simulated balances are recorded separately. | Billing One-time [23] Activation $0.00 [30] Paid reset fee Not verified Current reset availability/price unresolved. | Profit target $3,000.00 [30] Minimum trading days 2 [30] | Limit $2,000.00 [30] Calculation End-of-day trailing [30] Breach monitoring Not verified [30]Exact intraday enforcement for the evaluation stage not verified. Breach boundary Not verified Exact touch versus below operator not verified for this stage. Floor cap Not verified Evaluation floor locking not explicitly verified. | Rule or target 50% [31] Boundary At or below the threshold [31] Basis Best-day profit divided by total evaluation profit [31] Access days Not verified [23]One-time purchase has inactivity conditions, not a verified fixed expiry. |
| TradeifySelect Evaluation 40% / Select Flex / new purchase after 1 Sep 2026 $50,000.00 [25] Source noteNominal program size. Starting simulated balances are recorded separately. | Regular evaluation price $165.00 [24] Billing One-time [24] Activation $0.00 [25] Paid reset fee $109.00 [24] | Profit target $3,000.00 [25]Current dashboard purchase. Legacy accounts retain 2500 target. Minimum trading days 3 [25] | Limit $2,000.00 [25] Calculation End-of-day trailing [26] Breach monitoring Real-time net liquidation value [26] Breach boundary At or below the loss floor [26] Source noteNet liquidation value touching the current loss floor breaches the account.Floor cap Not applicable [26]Evaluations do not lock their drawdown floor. | Rule or target 40% [25]50% add-on excluded. Boundary At or below the threshold [25] Basis Best-day profit divided by total evaluation profit [25] Access days Not verified Not verified for this exact evaluation stage. |
| Program | Account state | Drawdown | Payout conditions | Payout limits |
|---|---|---|---|---|
| TopstepTrading Combine Standard pricing / XFA Standard / no DLL add-on | Environment Simulated [5] Starting balance $0.00 [5] | Limit $2,000.00 [4] Calculation End-of-day trailing [4] Breach monitoring Real-time net equity [4] Breach boundary Floor cap $0.00 [4] Cap condition EOD balance reaches 2000, or first payout, whichever occurs first [4] | Consistency Not applicable [5]XFA Standard has no payout consistency target. XFA Consistency is a separate path. Boundary Not applicable [5]No consistency rule on selected funded path. Winning days 5 [6] Minimum winning day $150.00 [6] Buffer Not applicable [6]No separate safety-net earning threshold stated for XFA Standard; loss floor still applies. Minimum request balance Not verified Not verified for this exact simulated-funded stage. Other conditions
| Trader share 90% [6]New trader terms. Pre-12-Jan-2026 legacy concession excluded. Minimum request $125.00 [6] Maximum request $2,000.00 [6]50K XFA Standard without DLL offer. Also limited to 50% of balance. Balance share cap 50% [6] Maximum payout count Not verified Not verified for this exact simulated-funded stage. |
| Apex Trader FundingEOD Evaluation No Activation Fee / PA / Rithmic | Environment Simulated [10] Starting balance $50,000.00 [9]Displayed 50K PA balance; profits are simulated. | Limit $2,000.00 [10] Calculation End-of-day trailing [10] Breach monitoring Real-time net equity [10] Breach boundary Floor cap $50,100.00 [9] Cap condition Highest EOD balance reaches 52100 [9] | Consistency 50% [11]Strictly below 50%, unlike inclusive 50% rules. Boundary Below the threshold [11] Winning days 5 [11] Minimum winning day $250.00 [11] Buffer $2,100.00 [11]Lifetime profit safety net, separate from the 50100 drawdown floor. Minimum request balance $52,600.00 [11] Other conditions
| Trader share 100% [11]100% of approved simulated PA payout, not the separate live split. Minimum request $500.00 [11] First approved request cap $1,500.00 [11]First approved payout cap; subsequent caps stored separately. Caps by approved payout
Balance share cap Not verified Not verified for this exact simulated-funded stage. Maximum payout count 6 [11] |
| Apex Trader FundingIntraday Evaluation No Activation Fee / PA / Rithmic $50,000.00 [12] Source noteNominal program size. Starting simulated balances are recorded separately. | Environment Simulated [14] Starting balance $50,000.00 [13]Displayed 50K PA balance; profits are simulated. | Limit $2,000.00 [14] Calculation Intraday trailing [14] Breach monitoring Real-time net equity [14] Breach boundary Floor cap $50,100.00 [13] Cap condition Highest intraday equity, including unrealized gains reaches 52100 [13] | Consistency 50% [15]Strictly below 50%, unlike inclusive 50% rules. Boundary Below the threshold [15] Winning days 5 [15] Minimum winning day $200.00 [15] Buffer $2,100.00 [15]Lifetime profit safety net, separate from the 50100 drawdown floor. Minimum request balance $52,600.00 [15] Other conditions
| Trader share 100% [15]100% of approved simulated PA payout, not the separate live split. Minimum request $500.00 [15] First approved request cap $1,500.00 [15]First approved payout cap; subsequent caps stored separately. Caps by approved payout
Balance share cap Not verified Not verified for this exact simulated-funded stage. Maximum payout count 6 [15] |
| MyFundedFuturesBuilder Default / 2000 MLL / current one-time purchase $50,000.00 [21] Source noteNominal program size. Starting simulated balances are recorded separately. | Environment Simulated [21] Starting balance $0.00 [21] | Limit $2,000.00 [21] Calculation End-of-day trailing [21] Breach monitoring Not verified [21]Exact real-time enforcement is not clear in this plan-specific guide. Breach boundary Not verified Exact touch versus below operator not verified for this stage. Floor cap $100.00 [21]General account-rule lock at starting balance plus 100. Live table separately says zero. Cap condition Loss floor reaches starting balance plus 100 [21] | Consistency 50% [21] Boundary At or below the threshold [21] Winning days Not applicable [21]Requires two trading days, not a winning-day dollar threshold. Trading days 2 [21] Minimum winning day Not applicable [21]No daily dollar minimum stated in payout criteria. Buffer $2,100.00 [21] Minimum request balance $2,600.00 [21] Other conditions
| Trader share 80% [21] Minimum request $500.00 [21] Maximum request $2,000.00 [21] Balance share cap Not verified Not verified for this exact simulated-funded stage. Maximum payout count 5 [21] |
| MyFundedFuturesRapid Intraday / current one-time purchase $50,000.00 [30] Source noteNominal program size. Starting simulated balances are recorded separately. | Environment Simulated [30] Starting balance $0.00 [30] | Limit $2,000.00 [30] Calculation Intraday trailing [30] Breach monitoring Real-time net equity [32] Breach boundary Below the loss floor [30] Source noteCurrent plan-specific article says below the $100 locked floor breaches. Other generic descriptions may differ.Floor cap $100.00 [30] Cap condition Trailing floor reaches 100; high-water equity reaches 2100 [30]Plan-specific help takes precedence over older generic drawdown text. | Consistency Not applicable [30]No simulated-funded consistency rule. Boundary Not applicable [30]Not applied. Winning days Not applicable [30]Daily requests rely on buffer and minimum, not a five-winning-day cycle. Minimum winning day Not applicable [30]Not stated as a requirement. Buffer $2,100.00 [30]Realized-profit buffer must be earned before a request; separate from 100 loss floor. Minimum request balance Not verified [30]Buffer unlock is verified, but exact retained balance/withdrawable amount interaction is not fully stated. Other conditions
| Trader share 90% [30] Minimum request $500.00 [30] Maximum request Not verified No explicit maximum request amount verified for Rapid Intraday; Rapid EOD rules must not be substituted. Balance share cap Not verified Not verified for this exact simulated-funded stage. Maximum payout count Not verified Not verified for this exact simulated-funded stage. |
| TradeifySelect Evaluation 40% / Select Flex / new purchase after 1 Sep 2026 $50,000.00 [25] Source noteNominal program size. Starting simulated balances are recorded separately. | Environment Simulated [28] Starting balance $50,000.00 [27] | Limit $2,000.00 [27] Calculation End-of-day trailing [26] Breach monitoring Real-time net liquidation value [26] Breach boundary At or below the loss floor [26] Source noteNet liquidation value touching the current loss floor breaches the account.Floor cap $50,100.00 [26] Cap condition EOD balance reaches 52100, or payout is requested, whichever occurs first [26] | Consistency Not applicable [27]No consistency rule once funded. Boundary Not applicable [27]Not applied. Winning days 5 [27] Minimum winning day $150.00 [27] Buffer Not applicable [27]Select Flex has no payout buffer. Select Daily 2100 buffer does not apply. Minimum request balance Not applicable [27]No separate minimum balance requirement; winning days, request cap and loss floor still apply. Other conditions
| Trader share 90% [27] Minimum request $250.00 [27] Maximum request $2,500.00 [27]50K Select Flex purchased after 1 Sep 2026; old 3000 cap excluded. Balance share cap 50% [27]50% of total profit position: current balance minus starting balance. Maximum payout count Not verified Not verified for this exact simulated-funded stage. |
Enable JavaScript to estimate selected charges. Verified prices are shown in the table.
Verified evaluation, paid reset and activation charges only. Data, platform, commissions, taxes and other charges are excluded. Reset credits and promotions are not applied. One-time access limits still apply. Passing and payout eligibility are separate.
FXIFY Futures leads on 88/100, ahead of FundedNext Futures (88) and Blueberry Futures (85), across all 16 futures prop firms we track. Scores come from verified data, and change only when a firm's data does.
See all rankingsScores are produced by our published methodology. See the full rankings for every firm we track.
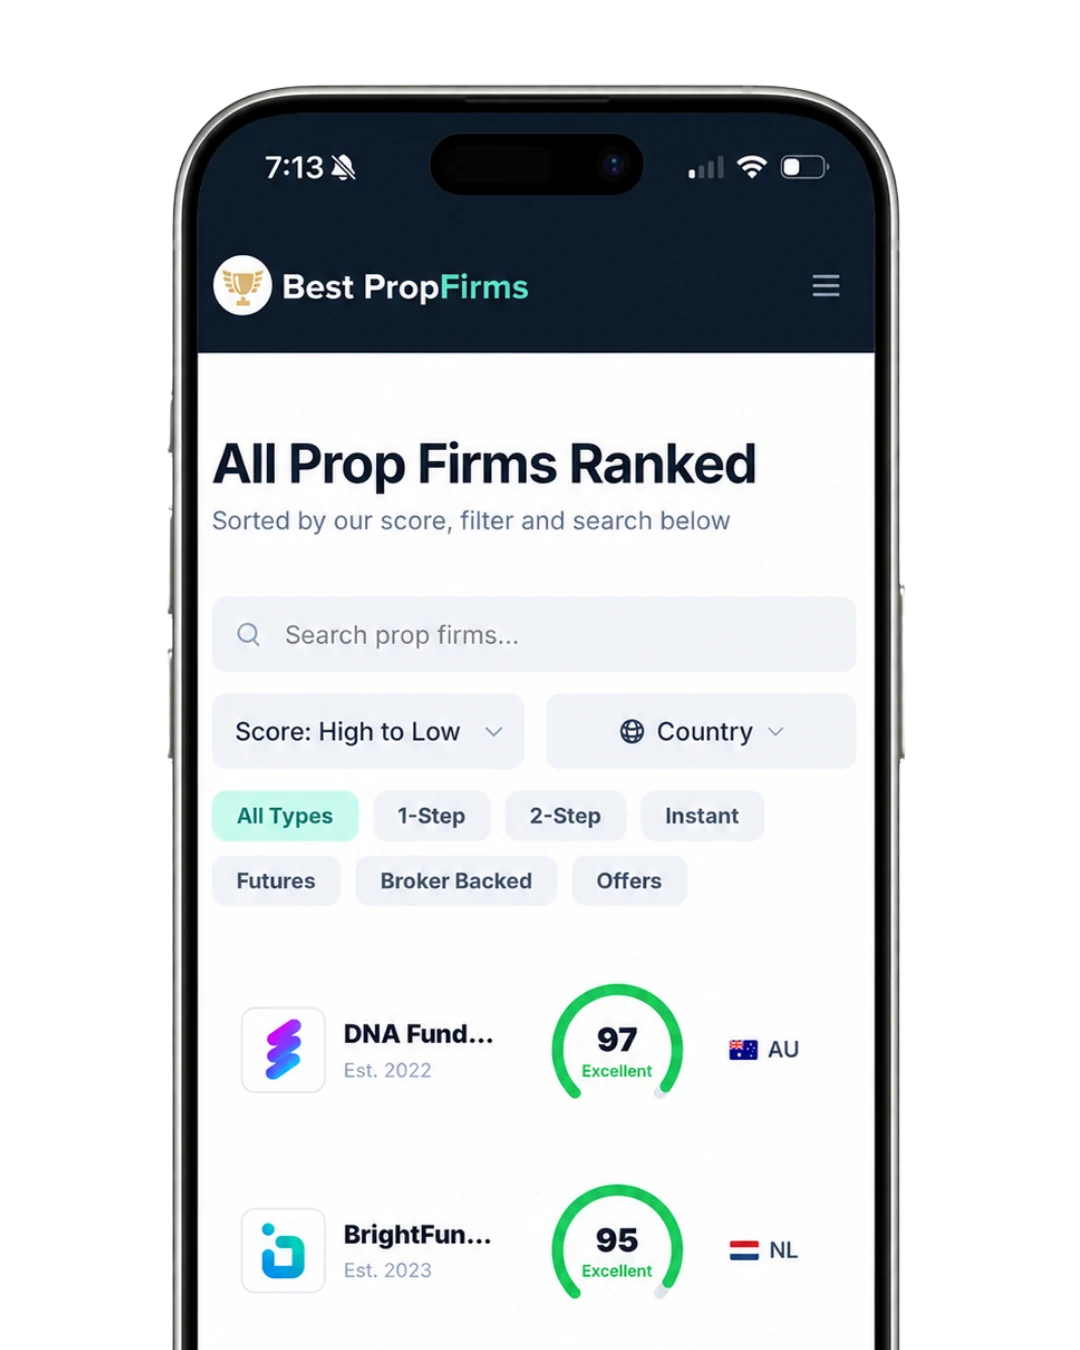
Sorted by our score, filter and search below
Search by firm name, filter by evaluation type, broker backing or active offer, and sort by BPF Score or rank. All 16 futures prop firms stay on the page — nothing is hidden behind pagination.
| Country | Profit split | Challenge from | Platforms | Promo | Review | ||
|---|---|---|---|---|---|---|---|
1  | 88 Excellent out of 100 | IE | 100% | $89 | Tradovate, TradingView, NinjaTrader | 15% OFF | Read Review Visit FXIFY Futures |
2  | 88 Excellent out of 100 | AE | 95% | $79.99 | Tradovate, NinjaTrader, TradingView | 10% OFF | Read Review Visit FundedNext Futures |
3  | 85 Great out of 100 | AU | 90% | $110.40 | BlackArrow | No Offer - | Read Review Visit Blueberry Futures |
4  | 82 Great out of 100 | IL | 80% | $59 | BlackArrow | No Offer - | Read Review Visit The5ers Futures |
5  | 80 Good out of 100 | GB | 90% | $89 | AlphaTrader, TradingView, WealthCharts, Quantower, DeepChart | No Offer - | Read Review Visit Alpha Futures |
6  | 72 Fair out of 100 | US | 90% | $105 | Tradovate, NinjaTrader, TradingView, Quantower | No Offer - | Read Review Visit MyFundedFutures |
7  | 72 Fair out of 100 | US | 100% | $65 | NinjaTrader, R|Trader Pro, Sierra Chart, ScalpTool, Volfix.net, Agena Trader, Bookmap, Jigsaw Trading, MultiCharts, Medved Trader, Track 'n Trade, Trade Navigator, MotiveWave, InsideEDGE Trader, Vetta, iTrader, Order Flow Trading, Photon Trade | No Offer - | Read Review Visit One Up Trader |
8  | 70 Fair out of 100 | US | 90% | $99 | Tradovate, NinjaTrader, WealthCharts, TradeSea | No Offer - | Read Review Visit Tradeify |
9  | 70 Fair out of 100 | US | 90% | $131 | Tradovate, Rithmic | No Offer - | Read Review Visit TradeDay |
10  | 68 Below Avg out of 100 | US | 100% | $40 | Match-Trader, MT5, cTrader, TradeLocker, E8 Futures Platform, Tradovate | No Offer - | Read Review Visit E8 Markets |
11  | 61 Poor out of 100 | US | 100% | — | Rithmic, Tradovate, WealthCharts, NinjaTrader, RTrader Pro | No Offer - | Read Review Visit Apex Trader Funding |
12  | 57 Poor out of 100 | US | 90% | $49 | TopstepX, NinjaTrader, TradingView, Tradovate, Quantower, T4 | No Offer - | Read Review Visit Topstep |
13  | 51 Poor out of 100 | LI | 80% | $49 | cTrader, NinjaTrader, Tradovate, Rithmic, Quantower, ATAS, Volsys, Volumetrica, TradingView | No Offer - | Read Review Visit The Trading Pit |
14  | 39 Poor out of 100 | AE | 100% | $134 | Quantower, Deepmap, NinjaTrader Prop, Tradovate Prop, Deepcharts, TickBlaze | No Offer - | Read Review Visit Goat Funded Futures |
15  | 73 Fair out of 100 | US | 80% | $150 | NinjaTrader, Finamark, Rithmic, Tradovate, BlackArrow, TradingView | No Offer - | Read Review Visit Earn2Trade |
16  | 48 Poor out of 100 | US | 100% | $75 | TradingView, NinjaTrader, Tradovate, R | Trader Pro, EdgeProX, Sierra Chart | No Offer - | Read Review Visit Elite Trader Funding |
Every figure in this table is taken from each firm’s own published challenge terms, payout policy and fee schedule, cross-checked against its Trustpilot profile for the trust component. Last verified . 2 of the 16 firms currently carry a verified discount code. Scores are produced by our published methodology.
We track 16 futures prop firms in this ranking, of which 16 carry a full score. FXIFY Futures leads on 88/100, ahead of FundedNext Futures on 88/100 , with the lowest scored firm at 39/100. Scores come from seven weighted criteria - challenges, spreads, markets, payouts, platforms, trust and support - applied identically to every firm, with no paid placement.
Entry pricing starts at $40 for the cheapest evaluation we list. Profit splits reach 100% at the top of the table. The fastest first payout on record is 1 day after funding. 3 of these firms offer an instant funding route that skips the evaluation entirely. 2 carry a verified discount code.
Platform coverage is widest on Tradovate (11 firms), NinjaTrader (10 firms) and TradingView (8 firms). Check platform support before rules or pricing: a favourable rule set on an execution platform you dislike is a bad trade.

Buyer's guide
Futures evaluations are priced and risk-managed differently from forex challenges. These five attributes decide the outcome, and each is scored on every firm in the table above.
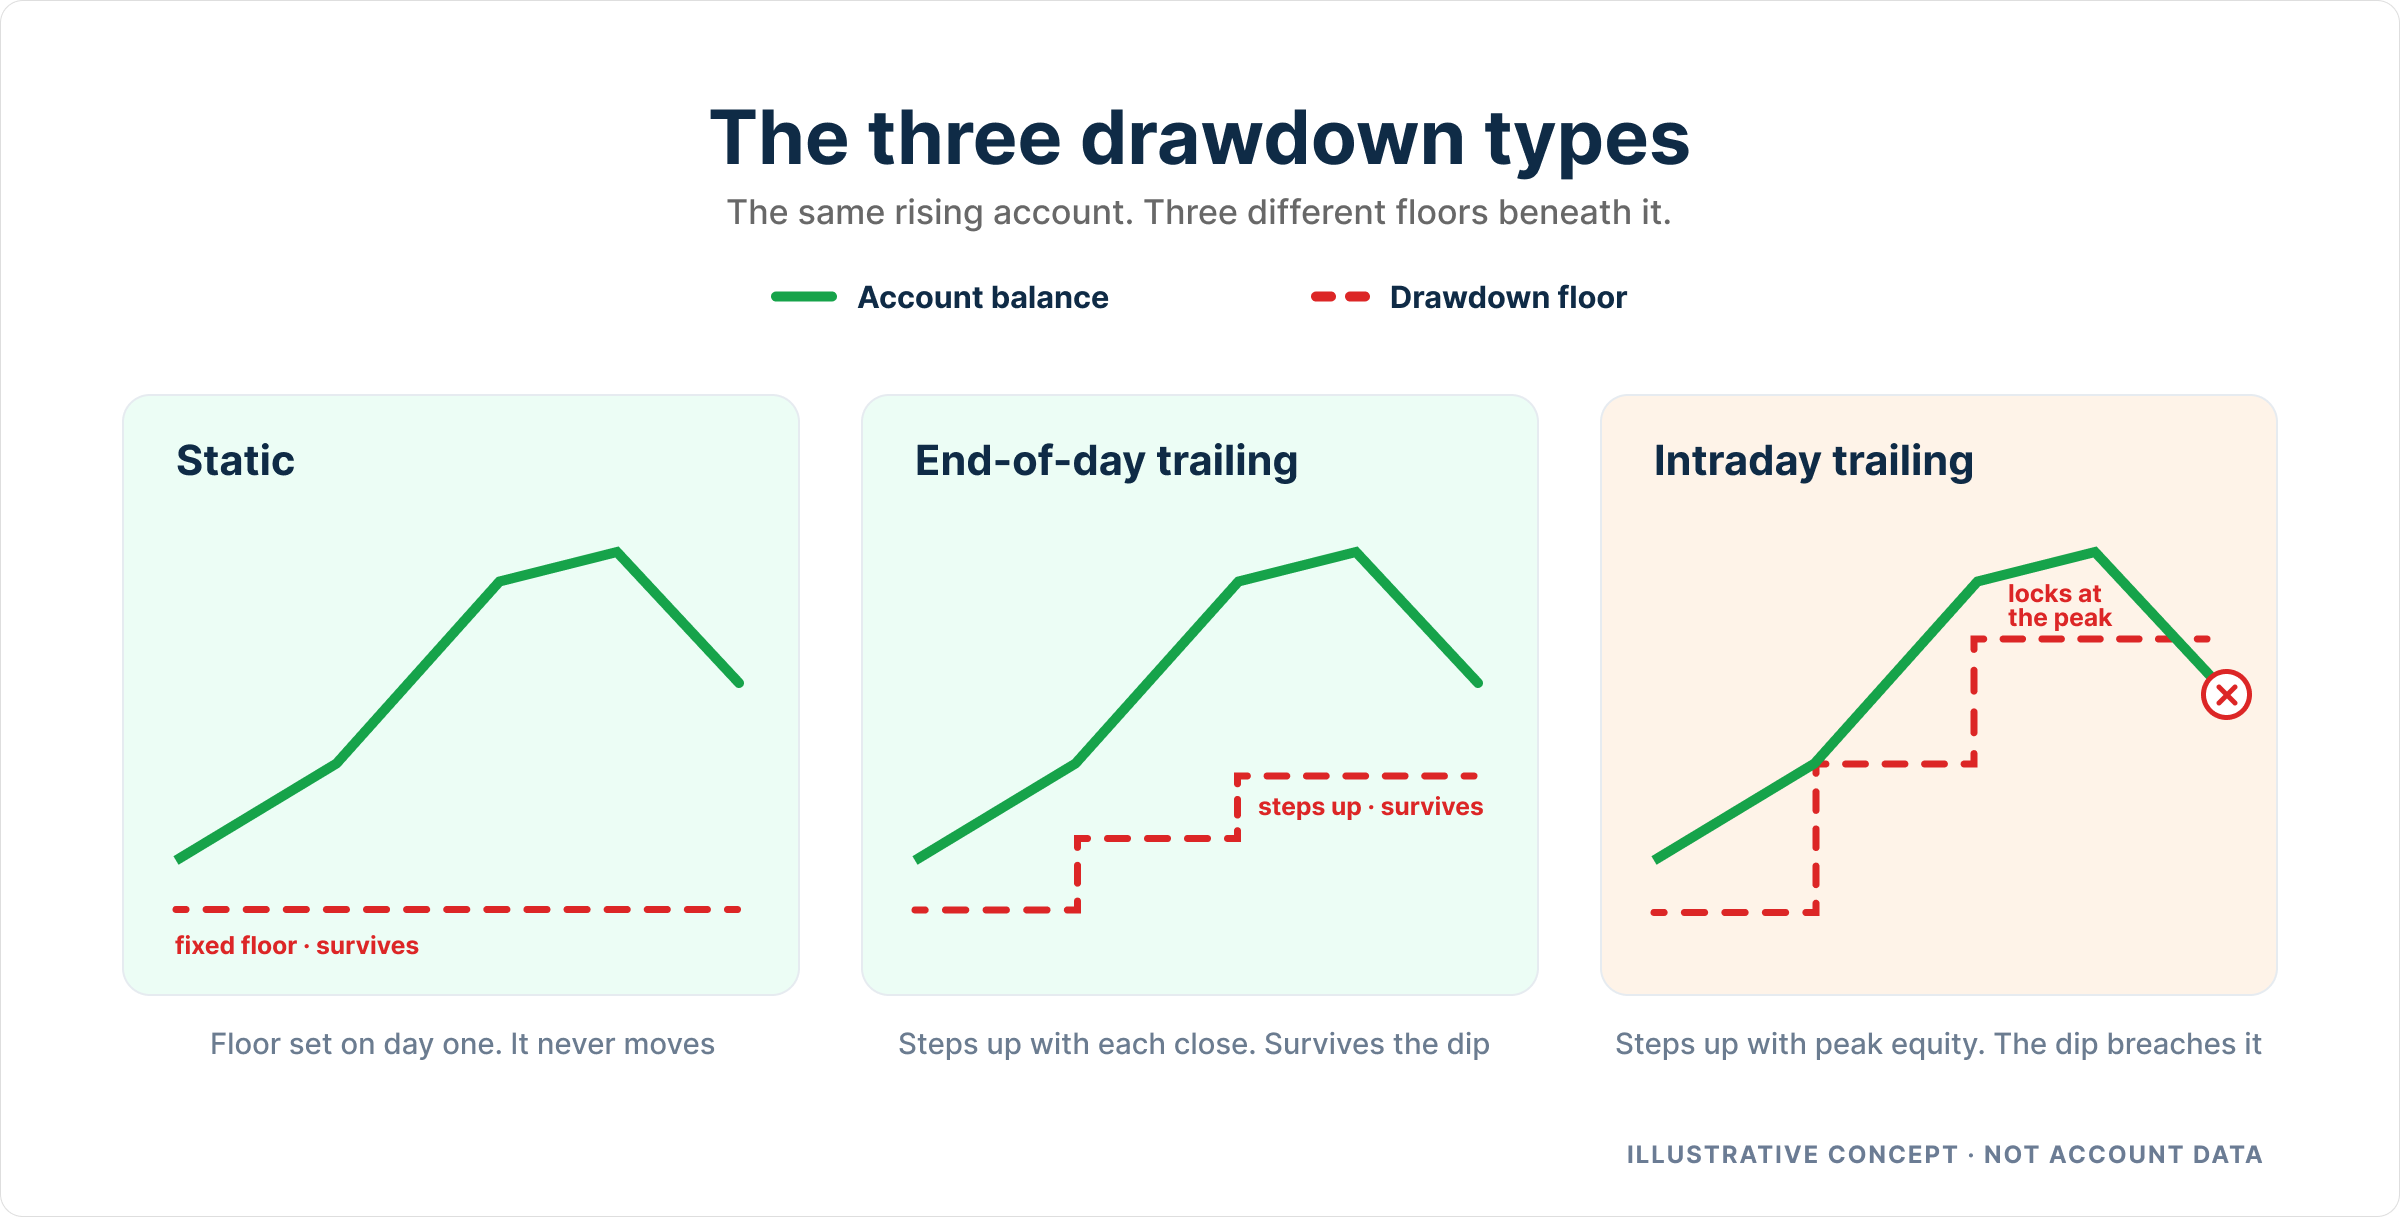
This is the single biggest difference between futures firms. An end-of-day trailing drawdown recalculates from your closing balance; an intraday trailing drawdown follows your unrealised equity high tick by tick and can close an account on an open position that later recovers. Two firms quoting the same drawdown figure can be far apart in practice.
Futures accounts cap how many contracts you may hold at once, and often apply a lower cap during the evaluation than after funding. The cap governs how much size you can express per idea, so read it alongside the profit target rather than on its own.
Trading CME, CBOT, NYMEX and COMEX products requires exchange market-data subscriptions, and round-turn commissions apply per contract. Both are recurring costs on top of the evaluation fee, and they are what make a cheap monthly account more expensive than it looks.
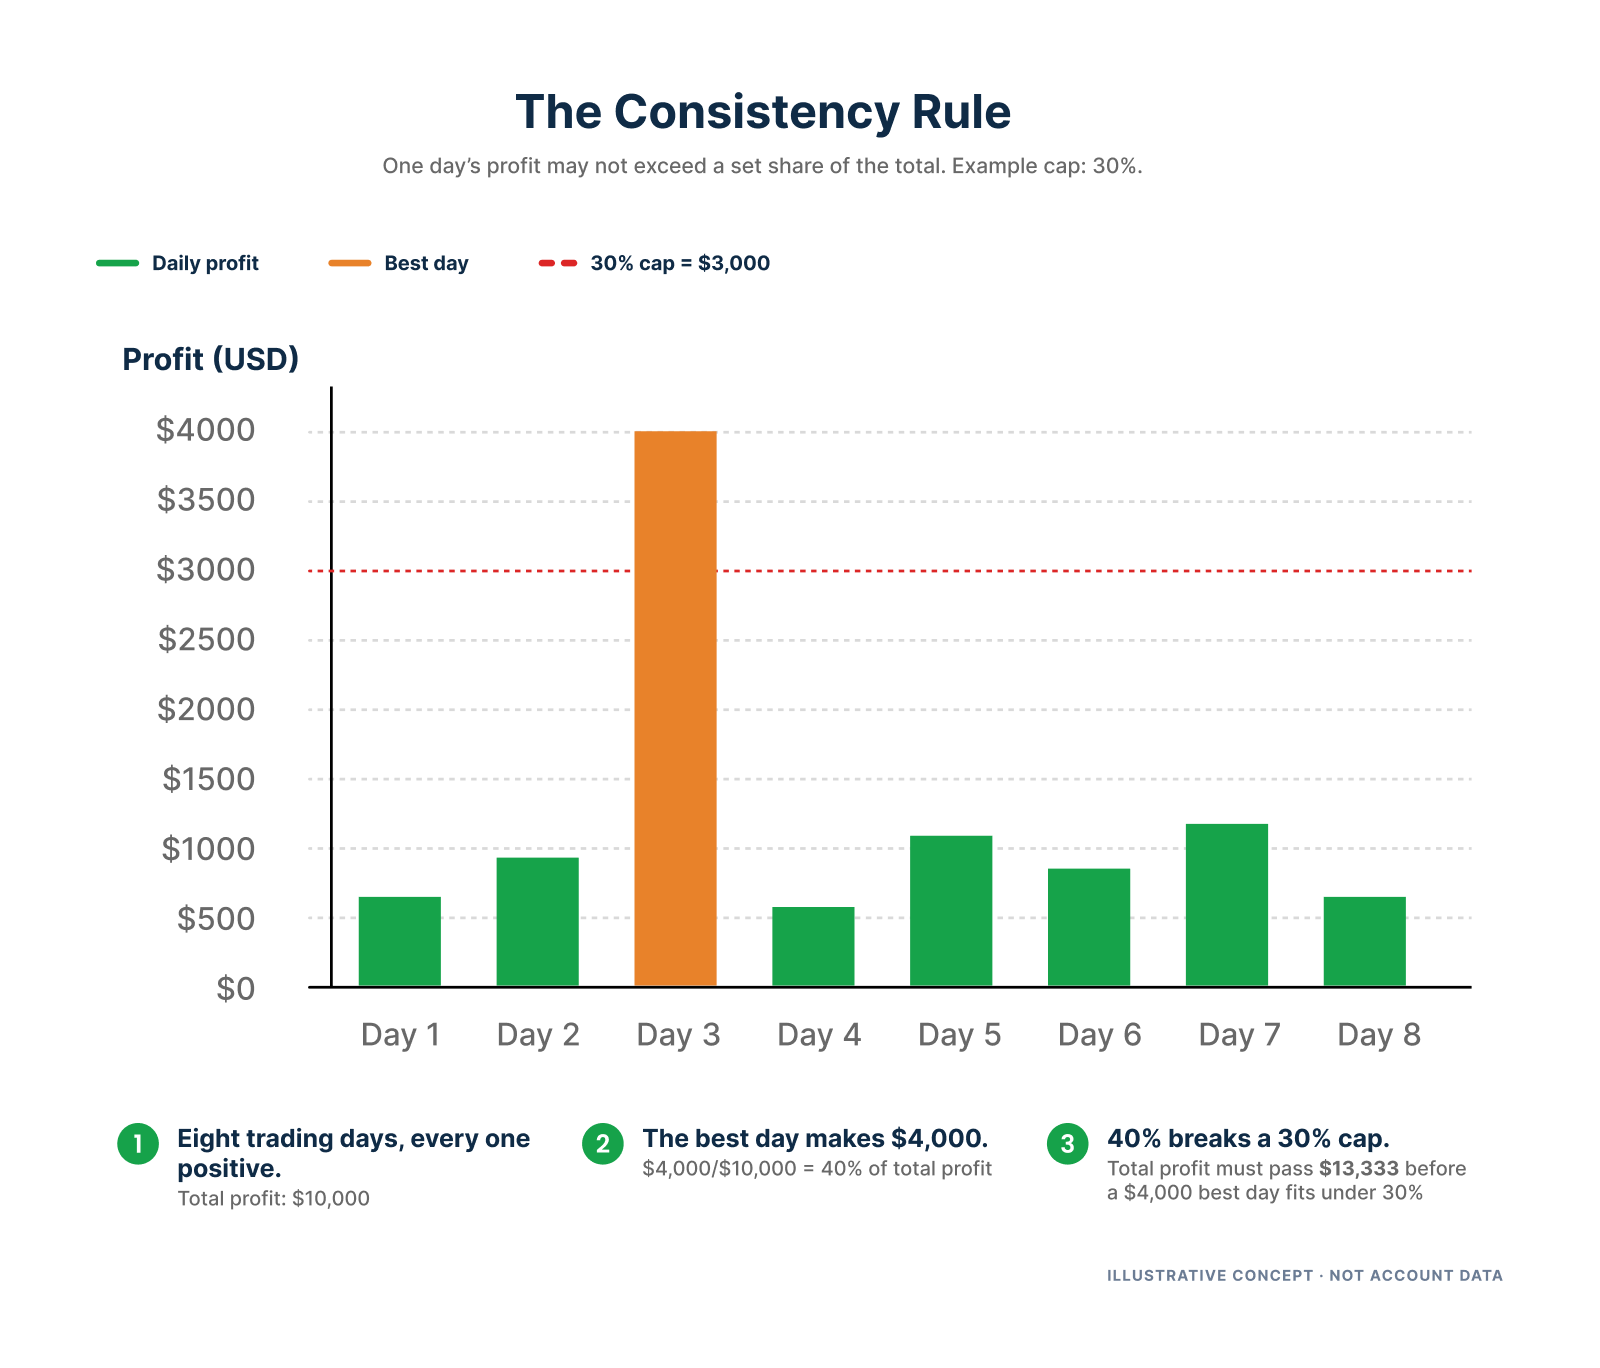
Futures firms commonly apply consistency rules that cap what share of total profit a single day may contribute, and hold the first payout behind a minimum number of winning days. A fast headline payout cycle means little if a consistency rule delays your eligibility.
Futures platforms differ more than forex ones: NinjaTrader, Tradovate, Rithmic and Quantower each expose different order types, DOM behaviour and automation support. Confirm the firm supports the platform and data feed you already trade before comparing anything else.
The table above ranks 16 futures prop firms on their published terms. The numbers that follow explain what sits behind those scores: how futures funding actually works, how it differs from forex and CFD alternatives, which platforms matter, and what the profit-sharing and risk rules mean once you look past the headline figures. Evaluation fees across these firms run from $40 to $1,627, and the highest advertised profit split a trader can reach runs from 80% to 100%. Both ranges are wide, and the reasons for that spread become clearer when you understand the structure of the market.
A futures prop firm is a proprietary trading company that funds traders to trade futures contracts under the firm’s rules and capital. Performance is tracked against contracts listed on regulated exchanges, including the CME, NYMEX and ICE. The instruments span equity indices, commodities, metals, energy and bonds. A trader passes an evaluation to become funded, then trades within risk controls such as drawdown limits and daily loss limits. That much is common across the category. What differs from the impression many newcomers bring is the technical and legal setting in which the trading takes place.
Most futures prop firms run evaluations on simulated accounts that mirror live exchange pricing, not live brokerage accounts in the trader’s name. Many keep the funded stage simulated as well, paying the trader’s profit share from the firm’s own funds based on simulated results. A smaller number move consistently profitable traders onto a live exchange account at a later stage. For that reason, the word “futures” does not automatically mean live trading. Whether a firm’s funded stage is simulated or live is worth checking in its terms before purchase, because the distinction affects execution, data fees and how the firm manages its own risk.
The choice between a futures and a forex prop firm is partly about market structure and partly about trading style. The table below sets out the main differences side by side.
| Feature | Futures prop firms | Forex prop firms |
|---|---|---|
| Market type | Centralised - CME, NYMEX, ICE | Decentralised, over-the-counter |
| Trading hours | Limited to exchange hours | 24 hours, five days a week |
| Contract size | Fixed. One E-mini S&P 500 contract is $50 per point | Flexible lot sizing |
| Leverage | 1:10 to 1:50, set by the exchange | Up to 1:100 on prop accounts |
| Asset classes | Indices, commodities, metals, bonds | Currency pairs - majors, minors, exotics |
| Pricing | Transparent and identical for every participant | Set by the broker, so it varies between firms |
| Market depth | High liquidity, limited order flow visibility | Deep liquidity, no central exchange |
Futures suits structured traders who prefer regulated exchanges, set contract sizes and access to assets such as commodities, indices and bonds. Forex suits traders who want continuous market access five days a week, higher leverage and the ability to size positions in smaller increments. Neither is inherently better, but they reward different habits. The forex side of the market is ranked separately on the site’s main prop firm rankings page.
A widespread assumption is that funded futures accounts are “real” and funded CFD accounts are not. That framing is wrong. For the large majority of traders, both are simulated through the evaluation and usually remain simulated after funding as well. What genuinely separates them is the instrument traded, who sets the price, the ongoing costs and the leverage available.
Futures accounts track standardised contracts priced on regulated exchanges. CFD accounts track over-the-counter products priced by the firm’s broker or liquidity provider, covering forex, indices, commodities and crypto. Many futures firms pass on exchange market data fees, and futures contracts roll on a fixed expiry schedule. CFD accounts carry neither of those costs. The figures in the table below are counted across the 16 futures firms and 27 CFD firms ranked on this site, so they describe the market as it currently stands rather than a typical case. Firms that offer both futures and CFDs are counted in each column.
| Funded futures accounts | Funded CFD accounts | |
|---|---|---|
| What you trade | Standardised contracts on regulated exchanges - CME, NYMEX, ICE - covering indices, metals, energy and bonds. | Over-the-counter products priced by the firm's broker or liquidity provider, covering forex, indices, commodities and crypto. |
| Who sets the price | The exchange. Pricing is transparent and identical for every participant. | The broker or liquidity provider, so spreads vary between firms on the same instrument. |
| Evaluation stage | Simulated, mirroring live exchange pricing. | Simulated, inside the firm's own risk model. |
| Funded stage | Usually still simulated, with the firm paying your share from its own funds. A minority move proven traders onto a live exchange account later. | Simulated with most firms, managed inside the firm's risk model. |
| Entry cost | $40 to $1,627 | $5 to $5,499 |
| Profit split ceiling | 80% to 100% | 80% to 100% |
| Ongoing costs | Exchange market data fees at many firms, and contracts roll on a fixed expiry schedule. | No exchange data fees and no contract expirations. |
| Position sizing | Fixed contract sizes, capped by the firm's contract limits. | Flexible lot sizing and generally higher leverage. |
Futures traders need low-latency platforms with depth-of-market data. Platform choice is one of the few things a trader cannot change after buying an evaluation, so it is worth settling before purchase. Across the 16 futures firms ranked on this page, support concentrates on a small number of platforms. The table below lists every platform supported by more than one firm. Platforms offered by only a single firm are excluded, because they do not represent a meaningful choice until that specific firm has already been chosen.
| Platform | Firms | Available at |
|---|---|---|
| Tradovate | 11 of 16 | Apex Trader Funding, E8 Markets, Earn2Trade, Elite Trader Funding, FXIFY Futures, FundedNext Futures, MyFundedFutures, The Trading Pit, Topstep, TradeDay, Tradeify |
| NinjaTrader | 10 of 16 | Apex Trader Funding, Earn2Trade, Elite Trader Funding, FXIFY Futures, FundedNext Futures, MyFundedFutures, One Up Trader, The Trading Pit, Topstep, Tradeify |
| TradingView | 8 of 16 | Alpha Futures, Earn2Trade, Elite Trader Funding, FXIFY Futures, FundedNext Futures, MyFundedFutures, The Trading Pit, Topstep |
| Quantower | 5 of 16 | Alpha Futures, Goat Funded Futures, MyFundedFutures, The Trading Pit, Topstep |
| Rithmic | 4 of 16 | Apex Trader Funding, Earn2Trade, The Trading Pit, TradeDay |
| BlackArrow | 3 of 16 | Blueberry Futures, Earn2Trade, The5ers Futures |
| WealthCharts | 3 of 16 | Alpha Futures, Apex Trader Funding, Tradeify |
| cTrader | 2 of 16 | E8 Markets, The Trading Pit |
Profit sharing varies by firm but follows a recognisable shape. Most firms let the trader keep 100% of the first $10,000 to $25,000 in profits, then move to a split of roughly 80% to 90%. Across the futures firms ranked on this page the split ceiling runs from 80% to 100%. Some firms raise the percentage in exchange for consistency, or scale the account size as the trader hits milestones. The headline percentage is rarely the whole story.
Whether a firm pays during the evaluation stage or only after funding, how often withdrawals are processed, and whether a consistency rule gates them all change what a trader actually collects. Consistency rules are close to universal in this category: 16 of 16 futures firms ranked here enforce one. A consistency rule typically caps how much of a trader’s total profit a single day may represent, which directly limits how quickly a payout can be built. Each firm’s individual review on the site records its own split, schedule and rules. The site also publishes a guide called “how prop firms pay traders” that walks through the mechanics in more detail.
Prop firms impose the risk parameters a self-funded trader would otherwise set for themselves. Breaching one is the most common way a funded account is lost. Trailing drawdowns are close to standard in futures. The loss floor moves up as the account grows, so profit made early does not buy room later. Where the trail stops matters more than the headline drawdown figure. Daily loss limits cap what may be lost in a single session, often as a fixed dollar figure that scales with account size. Contract limits cap how much leverage can actually be taken regardless of the account size on the label. Time restrictions bar trading through high-volatility news at some firms, or require positions to be flat before the close.
These rules are worth reading before the price, because they decide whether a given strategy is tradeable at a firm at all. A scalper who depends on holding through the close, or a swing trader who works around news events, will find some rulebooks impossible to follow no matter how attractive the split looks. The site publishes detailed guides on trailing drawdown, daily loss limits and risk management for prop traders that explain each mechanism in practice.
Connect with thousands of prop firm traders inside our Discord. Get real-time deal alerts, verified payout proof, firm rule changes as they happen, and honest discussion about which challenges are actually worth taking - all in one place, and free to join.
traders already in the community
Join DiscordOur Process
We read the firm's official terms, challenge rules, payout policies, and T&Cs. All data sourced directly with no third-party aggregators.
Each firm is scored across 7 categories: challenges, spreads, markets, payouts, platforms, trust and support. Challenges and payouts carry the heaviest weights because they decide what you pay and what you take home; support weighs least.
Data stored in one canonical record. Every metric on every page flows from that source with no duplicated values, no stale data.
Who's Behind the Scores

Justin Grossbard
CEO & Co-Founder
Co-founder of CompareForexBrokers with 10+ years covering brokers and prop firms. Leads the CFD review lane.

Noam Korbl
COO & Co-Founder
Co-founder of BestPropFirms and CompareForexBrokers. Leads the futures and payouts review lanes.
Read more about the team on our about page.
Got Questions?
Everything you need to know about prop trading firms and how we rank them.
From The Blog
Guides and explainers on how prop firms actually work, written against the same verified data as our rankings.
Calculate best-day profit as a share of net profit. Compare strict and inclusive limits and rules at evaluation and funded stages.
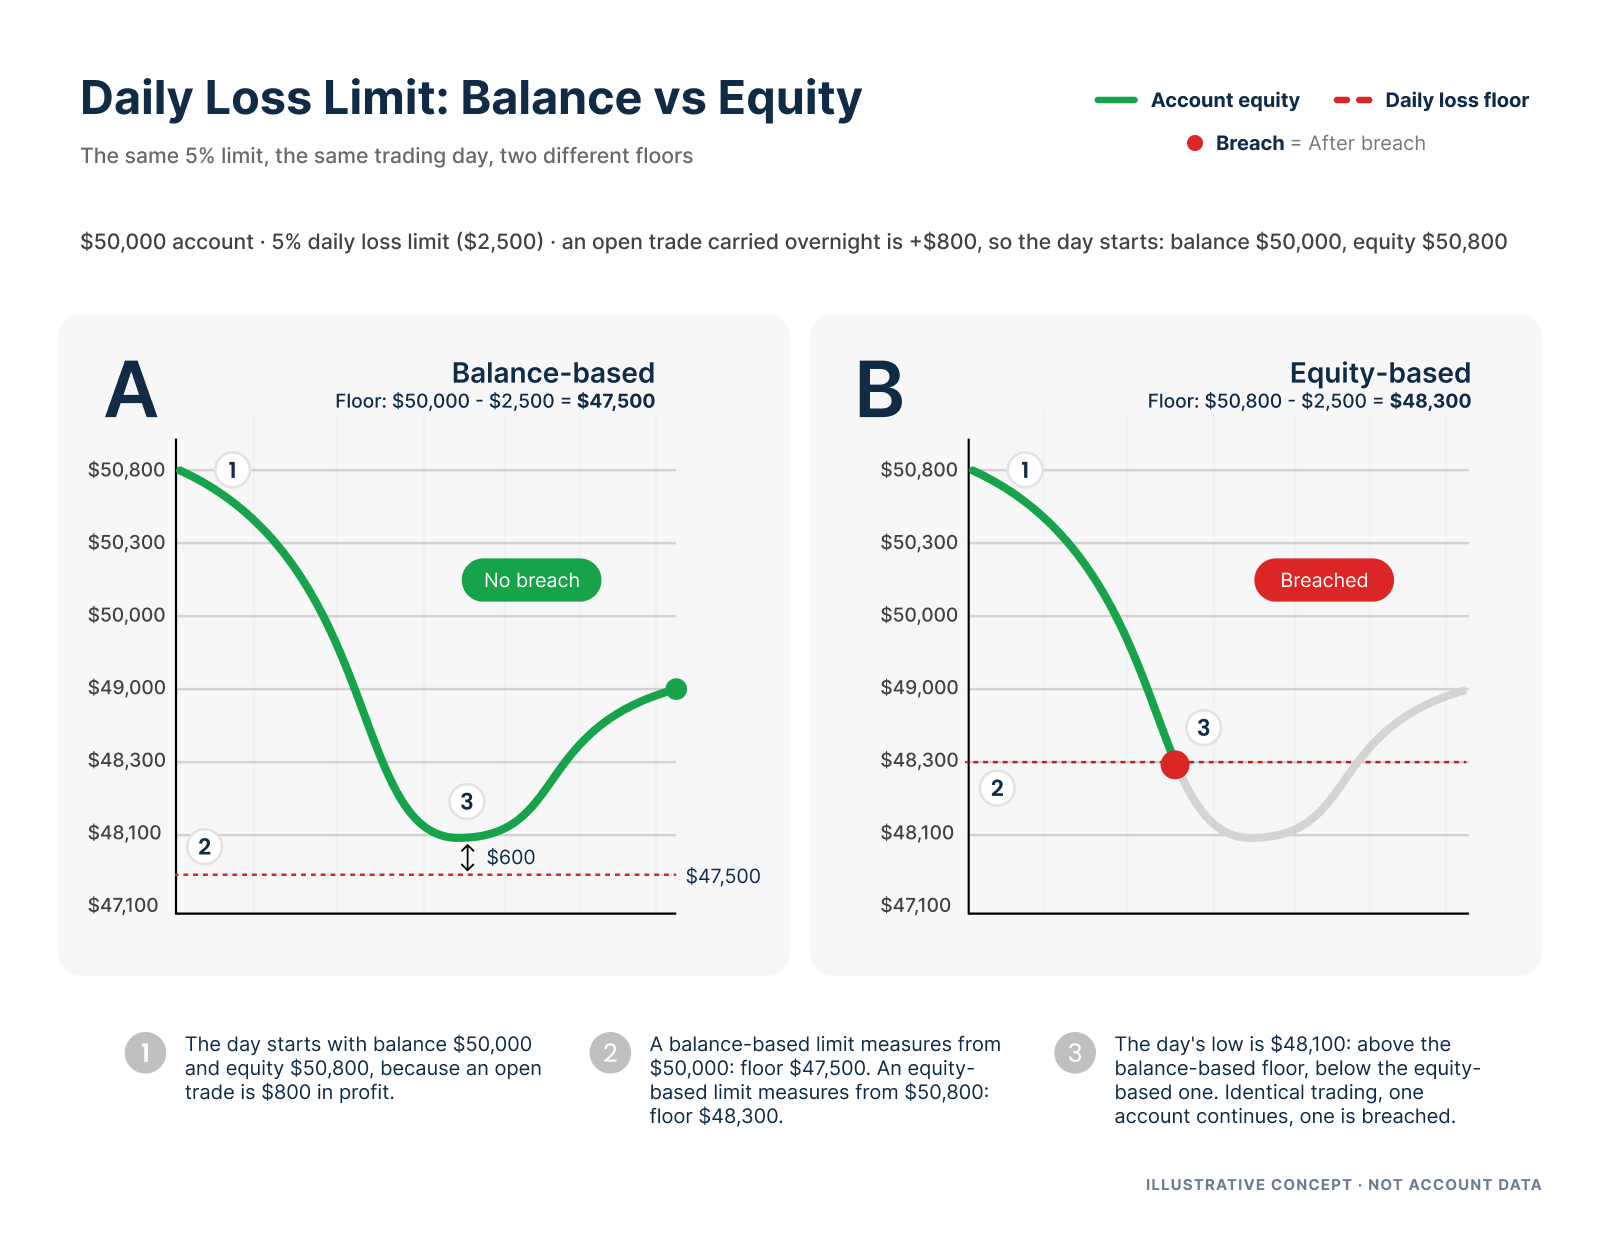
Calculate daily loss headroom from your opening balance, fixed allowance and net P/L. Compare reset risk and scoped programme rules.
Compare static, end-of-day and intraday drawdown floors, live equity monitoring, caps and payout effects using dated programme sources.